Strong H1 2026 performance funds near-term growth
VANCOUVER, British Columbia--BUSINESS WIRE--
Aris Mining Corporation (Aris Mining or the Company) (TSX: ARIS; NYSE: ARIS) announces its financial and operating results for the three and six months ended June 30, 2026 (Q2 2026 & H1 2026). All amounts are in U.S. dollars unless otherwise indicated.
This press release features multimedia. View the full release here: https://www.businesswire.com/news/home/20260729659384/en/
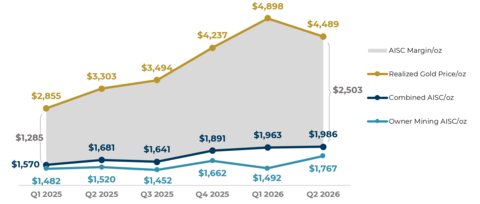
Figure 1: Combined AISC and Realized Gold Price Trends ($/oz) – Segovia
Q2 2026 Financial Performance
- Production of 73.7 thousand ounces (koz) of gold, consistent with Q1 2026.
- Gold revenue of $321 million, with an average realized gold price of $4,450.
- Adjusted EBITDA1 of $179 million, on a trailing 12-month basis, Adjusted EBITDA of $690 million.
- Adjusted net earnings of $96 million or $0.47/share, on a trailing 12-month basis, Adjusted net earnings of $386 million or $1.89/share.
- Cash balance of $426 million as of June 30, 2026, after funding $121 million in capital projects in Q2 2026, including $78 million at Marmato and $31 million at Segovia.
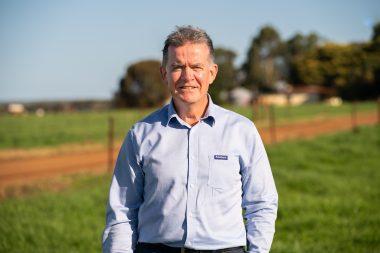
Neil Woodyer, Chair and CEO, commented “Aris Mining delivered another strong quarter with our operations generating the cash required to fund more than $120 million of capital investments during the second quarter while maintaining a strong balance sheet.
At Marmato, underground access connecting the Bulk Mining Zone to the new plant area is complete, the SAG and ball mills are on site, and mechanical installation is underway. Construction of the 5,000 tpd CIP plant continues to advance toward first gold and is on schedule for Q4 2026. At Segovia, increased investment in underground development and haulage infrastructure is building the mining capacity required to support higher production from the expanded processing facilities.
We remain on track to achieve our 2026 production guidance. With Segovia and Marmato providing a clear path toward approximately 500,0002 ounces of annual production, and Soto Norte and Toroparu continuing to advance, Aris Mining is well positioned to deliver its longer-term growth strategy.
At Soto Norte, the environmental studies and preparation of the environmental license application are nearing completion. At Toroparu, the prefeasibility study remains on schedule for completion in the second half of 2026.”
| Q2 2026 | Q1 2026 | H1 2026 | H1 2025 |
Gold production (koz), total | 73.7 | 74.3 | 148.0 | 113.4 |
Gold sold (koz), total | 72.1 | 74.8 | 147.0 | 115.3 |
Segovia – AISC, Owner Mining ($/oz sold) | $1,767 | $1,492 | $1,623 | $1,503 |
Segovia – CMP3 AISC Sales Margin | 46% | 40% | 43% | 41% |
EBITDA (US$M) | $163 | $182 | $344 | $71 |
Adjusted EBITDA (US$M) | $179 | $212 | $391 | $165 |
Adjusted EBITDA, last 12 months (US$M) | $690 | $610 | $690 | $264 |
Net earnings (loss)4 (US$M) | $94 or $0.46/sh | $98 or $0.47/sh | $192 or $0.93/sh | ($15) or ($0.08)/sh |
Adjusted earnings4 (US$M) | $96 or $0.47/sh | $124 or $0.60/sh | $220 or $1.07/sh | $75 or $0.43/sh |
Adjusted earnings4, last 12 months (US$M) | $386 or $1.89/sh | $337 or $1.71/sh | $386 or $1.89/sh | $113 or $0.64/sh |
Q2 & H1 2026 Operational Performance
- Segovia produced 64.4 koz, bringing H1 2026 production to 131.0 koz.
- Q2 2026 production reflected higher throughput, with 202.5 thousand tonnes (kt) processed at an average gold grade of 10.23 g/t, compared with 175.4 kt at 12.41 g/t in Q1 2026.
- Segovia’s Q2 results reflect continued investment in underground development to support the ramp-up toward consistent utilization of the expanded 3,000 tonnes per day (tpd) processing capacity installed in June 2025. Tonnes processed increased by 15% quarter-over-quarter to 202.5 kt, while total Segovia investment, including sustaining and non-sustaining capital, increased to $31 million in Q2 2026 from $17 million in Q1 2026.
- This investment of $48 million in H1 2026 is advancing the development work required to increase mining rates and improve haulage efficiency, including new ramps and a main underground haulage circuit connecting the El Silencio, Providencia and Sandra K mines. This work is being supported with the order of an expanded mining fleet through a combination of purchase and leasing arrangements to renew aging equipment and advance the expansion plan. Once complete, these initiatives are expected to support increased mill feed, more efficient transport of workers, mill feed and waste, shorter cycle times, and reduced traffic through town.
- Segovia generated an AISC margin of $157 million in Q2 2026, supported by higher tonnes processed and continued strong gold prices, bringing H1 2026 AISC margin to $356 million.
- Owner-operated mining contributed 67% of mill feed, while Contract Mining Partner (CMP) sourced material contributed 33%, consistent with Q1 2026.
- Owner-operated mining AISC was $1,767/oz for Q2 2026, bringing H1 2026 owner-operated mining AISC to $1,623/oz, below the full-year 2026 guidance range of $1,700 to $1,800/oz. The increase from Q1 2026 partly reflected higher sustaining capital as the Company increased investment in underground development to support higher mining capacity.
- CMP-sourced gold delivered an AISC sales margin of 46% in Q2 2026, bringing H1 2026 CMP AISC sales margin to 43%, above the top-end of the full-year 2026 guidance range of 35% to 40%.
- Combined AISC is $1,974/oz for H1 2026.
- Marmato produced 9.3 koz, bringing H1 2026 production to 17.1 koz.
- Q2 2026 production reflected the processing of 84.6 kt at an average gold grade of 3.79 g/t, compared to 77.0 kt at 3.53 g/t in Q1 2026.
- This increased production reflects the operating capacity of the existing flotation plant together with mill feed sourced primarily from ore development and stopes in the Bulk Mining Zone and CMPs operating in the Narrow Vein Zone.
- Throughput is expected to increase materially following commissioning of the new 5,000 tpd carbon-in-pulp (CIP) plant, with first gold expected in Q4 2026.
- Aris Mining plans to exit 2026 operating the new CIP plant at approximately 3,000 tpd, before ramping up through 2027 to approximately 4,000 tpd by mid-2027 and the full 5,000 tpd design capacity by the end of 2027, following commissioning of the paste backfill plant.
- 2026 Outlook
- Aris Mining remains on track to achieve its 2026 production guidance of 300,000 to 350,000 ounces of gold.
- H1 2026 production of 148 koz represents approximately 49% of the low end and 46% of the midpoint of the full-year guidance range, with production expected to be weighted to the second half of the year.
- Segovia is expected to continue increasing mining capacity and production through the second half of the year.
- Marmato's new 5,000 tpd design-capacity CIP plant remains on schedule for first gold in Q4 2026, supporting the Company's 2026 production guidance for Marmato of 35,000 to 50,000 ounces.
- The lower end of the Marmato guidance range is expected to be achievable through the existing flotation plant, while the upper end assumes successful commissioning of the new CIP plant in Q4 2026.
Project Development Highlights
- Marmato expansion advancing toward commissioning and first gold
- Construction of the new 5,000 tpd design-capacity CIP plant remains on schedule for first gold in Q4 2026.
- The SAG and ball mills are on site and mechanical installation is underway.
- The Bulk Mining Zone is prepared to support the initial ramp-up of the new CIP plant. The underground connection completed earlier this year established direct access between the Bulk Mining Zone and the new process plant area, improving access, ventilation and haulage, and supporting the planned production ramp-up.
- As at July 1, 2026, the estimated capital required to achieve first gold from the Marmato CIP plant in Q4 2026 is approximately $118 million. After the final $42 million installment expected from Wheaton Precious Metals in Q3 2026, the net funding requirement of approximately $76 million will be funded from the Company’s cash balance and operating cash flow.
- Toroparu Project progressing toward a potential early 2027 construction decision
- The Prefeasibility Study (PFS) remains on schedule for completion in H2 2026, supporting a construction decision targeted for early 2027.
- Project optimization work in support of the PFS includes updated mine scheduling, engineering studies and other activities to advance to construction readiness.
- Pre-construction activities underway, including construction of the Puruni River bridge, camp expansion, road improvements and other site infrastructure.
- The project team has grown to 100 employees in Guyana, with several key leadership appointments made during the quarter to support project development and execution.
- Aris Mining continues active engagement with the Government of Guyana and the Guyana Geology and Mines Commission (GGMC) to obtain the mining license and keep stakeholders informed of project progress.
- Preliminary Economic Assessment (PEA) completed in October 2025, outlining an attractive project with average annual gold production of 235 koz and an after-tax NPV5% of $1.8 billion, IRR of 25%, and 3.0-year payback at an assumed gold price of $3,000/oz.5
- Soto Norte Project nearing completion of environmental studies and environmental license application preparation
- The project incorporates industry-leading environmental and social design features, including a metallurgical process free of cyanide and mercury, together with a CMP program that allocates approximately 750 tpd of processing capacity to local miners, over 20% of Soto Norte’s 3,500 tpd processing capacity.
- The environmental studies and preparation of the environmental license application are nearing completion.
- PFS completed in September 2025, demonstrating robust economics with average annual gold production (years 2 to 10) of 263 koz and an after-tax NPV5% of $2.7 billion, IRR of 35%, and 2.3-year payback at an assumed gold price of $2,600/oz.6 Strong leverage to higher gold prices, at $3,000/oz the NPV5% increases to $3.3 billion with an IRR of 40%.
Q2 2026 Conference Call Details
Management will host a conference call on Wednesday, July 29, 2026, at 2:30 pm PT / 5:30 pm ET / 9:30 pm GMT to discuss the results.
Participants may gain expedited access to the conference call by registering at Diamond Pass Registration. Once registered, call-in details will be displayed on screen which can be used to bypass the operator and avoid the call queue. Registration will remain open until the end of the live conference call.
Webcast
Conference Call
- Toll-free North America: +1-833-821-0197
- International: +1-647-846-2328
Audio Recording
- After the call, an audio recording will be available via telephone until end of day on August 5, 2026
- Toll-free in the US and Canada: +1-855-669-9658
- International: +1-412-317-0088; and using the access code: 2624894
Aris Mining's Condensed Consolidated Interim Financial Statements for the three and six months ended June 30, 2026 and related MD&A are available on SEDAR+, in the Company’s filings with the U.S. Securities and Exchange Commission (the SEC) and in the Financials section of Aris Mining's website here. Hard copies of the financial statements are available free of charge upon written request to [email protected].
About Aris Mining
Aris Mining is a Canadian gold mining company focused on South America. The Company operates the Segovia and Marmato underground gold mines in Colombia, which together produced approximately 257,000 ounces of gold in 2025. Aris Mining is listed on the Toronto Stock Exchange and the New York Stock Exchange under the symbol ARIS.
The Company is advancing expansion projects at Segovia and Marmato that are expected to increase annual gold production to approximately 500,000 ounces2, driven by the ramp-up at Segovia following the installation of the second mill which was completed in June 2025, and construction of the new Marmato bulk mine and CIP plant, with first gold expected in Q4 2026.
Aris Mining’s portfolio supports a longer-term objective of approximately 1 million ounces of annual gold production7. Key projects include the high-grade Soto Norte gold project in Colombia and the Toroparu gold project in Guyana, where a Prefeasibility Study is in progress and a construction decision is expected in early 2027.
Additional information on Aris Mining can be found at www.aris-mining.com, www.sedarplus.ca, and on www.sec.gov.
Endnotes
1. All references to adjusted earnings, EBITDA, adjusted EBITDA, growth capital investment, cash flow after sustaining capital and income taxes, cash costs ($ per oz) and AISC ($ per oz) are non-GAAP financial measures in this document. These measures are intended to provide additional information to investors. They do not have any standardized meanings under IFRS, and therefore may not be comparable to other issuers and should not be considered in isolation or as a substitute for measures of performance prepared in accordance with IFRS. Refer to the Non-GAAP Measures section in this document for a reconciliation of these measures to the most directly comparable financial measure disclosed in the Company’s financial statements.
2. Reflects expected steady-state annual gold production run-rates of approximately 300 koz at Segovia and 200 koz at Marmato following completion and ramp-up of the respective expansion projects. For more information, please refer to the Company’s news releases dated June 30, 2025 regarding the Segovia expansion and March 12, 2025 regarding the Marmato expansion
3. Aris Mining operates its own mines and contracts with community-based mining partners, referred to as Contract Mining Partners or CMPs, to increase total gold production. Some partners work within Aris Mining’s infrastructure, while others manage their own mining operations on Aris Mining’s titles using their own infrastructure. In addition, Aris Mining purchases high grade mill feed from third-party contractors operating off-title, which further optimizes production and increases operating margins.
4. Net earnings represents net earnings attributable to owners of the company, as presented in the annual and interim financial statements for the relevant period.
5. See technical report dated October 28, 2025 and entitled “NI 43-101 Technical Report Preliminary Economic Assessment for the Toroparu Project Cuyuni-Mazaruni Region, Guyana”. Note that this PEA is preliminary in nature. It includes inferred mineral resources that are considered too speculative geologically to have the economic considerations applied to them that would enable them to be categorized as mineral reserves, and there is no certainty that the preliminary economic assessment will be realized. Mineral resources that are not mineral reserves do not have demonstrated economic viability.
6. See technical report dated September 3, 2025 and entitled “NI 43-101 Technical Report Prefeasibility Study for the Soto Norte Project, Santander, Colombia.”
7. Includes potential production estimates from Toroparu, which is based on a preliminary economic assessment effective October 21, 2025, which contemplates a 7.0 Mtpa operation over a 21.3-year mine life with average annual gold production of approximately 235 koz at a base case gold price of US$3,000/oz. The preliminary economic assessment is preliminary in nature and includes inferred mineral resources that are considered too speculative geologically to have the economic considerations applied to them that would enable them to be categorized as mineral reserves, and there is no certainty that the preliminary economic assessment will be realized. Mineral resources that are not mineral reserves do not have demonstrated economic viability. There can be no assurance that the projected production will be achieved. In the case of Soto Norte and Toroparu, such production also remains subject to obtaining all necessary permits and to formal construction decisions by the Company.
Non-GAAP Measures
Cash costs & all-in sustaining cost per ounce
| For the three months ended, |
| |||
Segovia | Jun 30, 2026 | Mar 31, 2026 | Jun 30, 2025 | March 31, 2025 | |
Total gold sold (ounces) | 62,762 | 67,709 | 53,751 | 47,390 | |
Cost of sales1 | 110,226 | 116,108 | 76,719 | 67,091 | |
Less: royalties1 | (10,741) | (11,139) | (5,539) | (4,519) | |
Add: by-product revenue1 | (8,703) | (7,449) | (2,798) | (3,073) | |
Total cash costs | 90,782 | 97,520 | 68,382 | 59,499 | |
Add: royalties1 | 10,741 | 11,139 | 5,539 | 4,519 | |
Add: social contributions1 | 8,661 | 12,358 | 5,177 | 4,061 | |
Add: sustaining capital expenditures and lease payments | 14,473 | 11,917 | 11,284 | 6,336 | |
Total AISC | 124,657 | 132,934 | 90,382 | 74,415 | |
AISC per ounce sold | $1,986 | $1,963 | $1,681 | $1,570 | |
Marmato |
|
|
|
| |
Total gold sold (ounces) | 9,362 | 7,134 | 7,273 | 6,891 | |
Cost of sales1 | 26,542 | 23,096 | 17,255 | 15,384 | |
Less: royalties1 | (3,938) | (3,332) | (2,044) | (1,840) | |
Add: by-product revenue1 | (123) | (306) | (427) | (313) | |
Total cash costs | 22,481 | 19,458 | 14,784 | 13,231 | |
Add: royalties1 | 3,938 | 3,332 | 2,044 | 1,840 | |
Add: social contributions1 | 392 | 940 | 385 | 273 | |
Add: sustaining capital expenditures | 1,791 | 1,481 | 1,426 | 733 | |
Total AISC | 28,602 | 25,211 | 18,639 | 16,077 | |
Consolidated |
|
|
|
| |
Total gold sold (ounces) | 72,124 | 74,843 | 61,024 | 54,281 | |
Cost of sales1 | 136,768 | 139,204 | 93,974 | 82,475 | |
Less: royalties1 | (14,679) | (14,471) | (7,583) | (6,359) | |
Add: by-product revenue1 | (8,826) | (7,755) | (3,225) | (3,386) | |
Total cash costs | 113,263 | 116,978 | 83,166 | 72,730 | |
Add: royalties1 | 14,679 | 14,471 | 7,583 | 6,359 | |
Add: social contributions1 | 9,053 | 13,298 | 5,562 | 4,334 | |
Add: sustaining capital expenditures and lease payments | 16,264 | 13,398 | 12,710 | 7,069 | |
Total AISC | 153,259 | 158,145 | 109,021 | 90,492 | |
- As presented in the financial statements and notes thereto for the respective periods
All-in sustaining cost per ounce – business units (Segovia)
| For the three months ended, |
| |||||
Segovia - Owner Mining | June 30, 2026 | Mar 31, 2026 | Dec 31, 2025 | Sep 30, 2025 | Jun 30, 2025 | Mar 31, 2025 | |
Total gold sold (ounces) | 41,520 | 45,789 | 40,260 | 40,984 | 32,685 | 26,963 | |
Cost of sales1 | 61,207 | 54,858 | 52,773 | 48,502 | 39,532 | 34,799 | |
Less: inventory provision | — | — | (895) | — | — | — | |
Less: royalties1 | (7,415) | (7,805) | (5,689) | (5,000) | (3,605) | (2,783) | |
Add: by-product revenue1 | (5,771) | (5,037) | (3,610) | (2,566) | (1,714) | (1,748) | |
Total cash costs | 48,021 | 42,015 | 42,578 | 40,936 | 34,213 | 30,268 | |
Add: royalties1 | 7,415 | 7,805 | 5,689 | 5,000 | 3,605 | 2,783 | |
Add: social contributions1 | 5,961 | 8,660 | 6,058 | 5,155 | 3,366 | 2,501 | |
Add: sustaining capital and lease payments | 11,949 | 9,835 | 12,601 | 8,430 | 8,511 | 4,397 | |
Total AISC | 73,346 | 68,315 | 66,926 | 59,521 | 49,695 | 39,949 | |
AISC ($/oz sold) | $1,767 | $1,492 | $1,662 | $1,452 | $1,520 | $1,482 | |
Segovia - CMPs |
|
|
|
|
| |||||
Total gold sold (ounces) | 21,242 | 21,920 | 24,196 | 24,596 | 21,066 | 20,427 | ||||
Cost of sales1 | 49,019 | 61,250 | 50,271 | 44,747 | 37,187 | 32,292 | ||||
Less: inventory provision | — | — | (279) | — | — | — | ||||
Less: royalties1 | (3,326) | (3,334) | (2,909) | (2,532) | (1,934) | (1,736) | ||||
Add: by-product revenue1 | (2,932) | (2,412) | (2,218) | (1,550) | (1,084) | (1,325) | ||||
Total cash costs | 42,761 | 55,505 | 44,865 | 40,665 | 34,169 | 29,231 | ||||
Add: royalties1 | 3,326 | 3,334 | 2,909 | 2,532 | 1,934 | 1,736 | ||||
Add: social contributions1 | 2,700 | 3,698 | 3,110 | 2,632 | 1,811 | 1,560 | ||||
Add: sustaining capital and lease payments | 2,524 | 2,082 | 4,053 | 2,256 | 2,773 | 1,939 | ||||
Total AISC | 51,311 | 4,619 | 54,937 | 48,085 | 40,687 | 34,466 | ||||
AISC ($/oz sold) | $2,415 | $2,948 | $2,270 | $1,955 | $1,931 | $1,687 | ||||
Segovia - Combined |
|
|
|
|
|
| ||||
Total gold produced (ounces) | 64,424 | 66,567 | 63,137 | 65,549 | 51,527 | 47,549 | ||||
Total gold sold (ounces) | 62,762 | 67,709 | 64,456 | 65,580 | 53,751 | 47,390 | ||||
Gold revenue | 281,764 | 331,611 | 273,127 | 229,116 | 177,551 | 135,310 | ||||
Avg realized gold price ($/oz sold) | $4,489 | $4,898 | $4,237 | $3,494 | $3,303 | $2,855 | ||||
Cost of sales1 | 110,226 | 116,108 | 103,043 | 93,249 | 76,719 | 67,091 | ||||
Less: inventory provision | — | — | (1,174) | — | — | — | ||||
Less: royalties1 | (10,741) | (11,139) | (8,598) | (7,532) | (5,539) | (4,519) | ||||
Add: by-product revenue1 | (8,703) | (7,449) | (5,828) | (4,116) | (2,798) | (3,073) | ||||
Combined cash costs | 90,782 | 97,520 | 87,443 | 81,601 | 68,382 | 59,499 | ||||
Add: royalties1 | 10,741 | 11,139 | 8,598 | 7,532 | 5,539 | 4,519 | ||||
Add: social contributions1 | 8,661 | 12,358 | 9,168 | 7,787 | 5,177 | 4,061 | ||||
Add: sustaining capital and lease payments | 14,473 | 11,917 | 16,654 | 10,686 | 11,284 | 6,336 | ||||
Combined AISC | 124,657 | 132,934 | 121,863 | 107,606 | 90,382 | 74,415 | ||||
AISC ($/oz sold) | $1,986 | $1,963 | $1,891 | $1,641 | $1,681 | $1,570 | ||||
AISC Margin | 157,108 | 198,677 | 151,264 | 121,510 | 87,169 | 74,415 | ||||
1. As presented in the financial statements and notes thereto for the respective periods
Operating free cash flow and free cash flow after growth and expansion capital
($’000) | Jun 30, 2026 | Mar 31, 2026 | Jun 30, 2025 | Mar 31, 2025 | |
Operating cash flows before taxes1 | 199,189 | 184,981 | 123,963 | 51,882 | |
Adjusting Items: |
|
|
|
| |
Precious metal stream deposit settled (received) 1 | — | (40,016) | — | — | |
Finance income1 | (4,166) | (3,383) | (3,474) | (2,336) | |
Impact of FX on cash and cash equivalents1 | 1,600 | 814 | 925 | 768 | |
Adjusted operating cash flows before taxes | 196,623 | 142,396 | 121,414 | 50,314 | |
|
|
|
|
| |
Less: Income taxes paid1 | (113,086) | (26,171) | (42,244) | (5,121) | |
Adjusted net cash provided by operating activities | 83,537 | 116,225 | 79,170 | 45,193 | |
|
|
|
|
| |
Less: Sustaining capital | (15,655) | (12,837) | (12,287) | (6,589) | |
Less: Sustaining lease payments | (609) | (561) | (423) | (480) | |
Cash flow from operations after sustaining capital and income taxes | 67,273 | 102,827 | 66,460 | 38,124 | |
|
|
|
|
| |
Less: Growth and expansion capital | (105,084) | (61,251) | (36,745) | (43,010) | |
Free cash flow after growth and expansion capital | (37,811) | 41,576 | 29,715 | (4,886) | |
1. As presented in the financial statements and notes thereto for the respective periods.
Additions to mineral interests, plant and equipment
($’000) | Jun 30, 2026 | Mar 31, 2026 | Jun 30, 2025 | Mar 31, 2025 |
Sustaining capital |
|
|
|
|
Segovia | 13,864 | 11,356 | 10,861 | 5,856 |
Marmato | 1,791 | 1,481 | 1,426 | 733 |
Total Sustaining Capital | 15,655 | 12,837 | 12,287 | 6,589 |
Non-sustaining capital |
|
|
|
|
Marmato | 76,290 | 47,031 | 23,628 | 29,661 |
Segovia | 17,279 | 5,454 | 6,930 | 6,368 |
Soto Norte Project and other | 5,576 | 3,445 | 3,446 | 4,570 |
Toroparu Project | 5,939 | 5,321 | 2,741 | 2,411 |
Total (Growth Capital Investment) | 105,084 | 61,251 | 36,745 | 43,010 |
Additions to mining interest, plant and equipment1 | 120,739 | 74,088 | 49,032 | 49,599 |
1. As presented in the financial statements and notes thereto for the respective periods.
Earnings before interest, taxes, depreciation, and amortization (EBITDA) and adjusted EBITDA
|
| |||
($000s) | Jun 30, 2026 | Mar 31, 2026 | Dec 31, 2025 | Sep 30, 2025 |
Earnings (loss) before tax1 | 141,579 | 161,672 | 97,519 | 76,094 |
Add back: |
|
|
|
|
Depreciation and depletion1 | 17,322 | 16,246 | 16,809 | 13,459 |
Finance income1 | (4,166) | (3,383) | (4,353) | (2,437) |
Interest and accretion1 | 7,803 | 7,408 | 10,431 | 9,390 |
EBITDA | 162,538 | 181,943 | 120,406 | 96,506 |
Add back: |
|
|
|
|
Share-based compensation1 | (809) | 7,602 | 20,663 | 9,497 |
(Income) loss from equity accounting in investee1 | — | — | (14) | — |
(Gain) loss on financial instruments1 | (26,548) | 1,762 | 3,058 | 6,385 |
Loss on disposal of mining interest and PPE1 | — | — | — | 3,200 |
Loss on settlement of deferred revenue1 | — | — | 4,990 | — |
Other (income) expense1 | 3,505 | 9,177 | 6,447 | 1,961 |
Foreign exchange (gain) loss1 | 39,902 | 11,590 | 12,446 | 13,520 |
Adjusted EBITDA | 178,588 | 212,074 | 167,996 | 131,069 |
1. As presented in the financial statements and notes thereto for the respective periods
($000s) |
| Jun 30, 2025 | Mar 31, 2025 | Dec 31, 2024 | Sep 30, 2024 |
Earnings (loss) before tax1 |
| 12,258 | 21,220 | 37,513 | 13,603 |
Add back: |
|
|
|
|
|
Depreciation and depletion1 |
| 11,929 | 10,734 | 9,530 | 9,019 |
Finance income1 |
| (3,474) | (2,336) | (1,606) | (1,351) |
Interest and accretion1 |
| 10,833 | 10,037 | 21,165 | 6,493 |
EBITDA |
| 31,546 | 39,655 | 66,602 | 27,764 |
Add back: |
|
|
|
|
|
Share-based compensation1 |
| 8,136 | 3,784 | (483) | 2,533 |
(Income) loss from equity accounting in investee1 |
| — | 14 | 14 | 17 |
(Gain) loss on financial instruments1 |
| 50,737 | 16,628 | (6,561) | 12,842 |
Other (income) expense1 |
| 1,090 | 535 | 1,116 | (428) |
Foreign exchange (gain) loss1 |
| 7,224 | 5,997 | (5,113) | 311 |
Adjusted EBITDA |
| 98,733 | 66,613 | 55,575 | 43,039 |
1. As presented in the financial statements and notes thereto for the respective periods.
Adjusted net earnings and adjusted net earnings per share
($000s except shares amount) | Jun 30, 2026 | Mar 31, 2026 | Dec 31, 2025 | Sep 30, 2025 | ||||
Basic weighted average shares outstanding1 | 206,398,410 | 205,967,201 | 203,245,172 | 199,171,052 | ||||
Net earnings (loss)1 | 94,243 | 97,614 | 50,863 | 42,011 | ||||
Add back: |
|
|
|
| ||||
Share-based compensation1 | (809) | 7,602 | 20,663 | 9,497 | ||||
(Income) loss from equity accounting in investee1 | — | — | (14) | — | ||||
(Gain) loss on financial instruments1 | (26,548) | 1,762 | 3,058 | 6,385 | ||||
Loss on disposal of mining interest and PPE1 | — | — | — | 3,200 | ||||
Loss on settlement of deferred revenue1 | — | — | 4,990 | — | ||||
Other (income) expense1 | 3,505 | 9,177 | 6,447 | 1,961 | ||||
Foreign exchange (gain) loss1 | 39,902 | 11,590 | 12,446 | 13,520 | ||||
Income tax effect on adjustments | (13,966) | (4,057) | (4,356) | (4,732) | ||||
Adjusted net earnings | 96,327 | 123,688 | 94,097 | 71,842 | ||||
Adjusted net earnings per share – basic ($/share) | 0.47 | 0.60 | 0.46 | 0.36 | ||||
1. As presented in the financial statements and notes thereto for the respective periods.
($000s except shares amount) | Jun 30, 2025 | Mar 31, 2025 | Dec 31, 2024 | Sep 30, 2024 |
Basic weighted average shares outstanding1 | 179,836,208 | 171,622,649 | 170,900,890 | 169,873,924 |
Net earnings (loss) 1 | (16,897) | 2,368 | 21,687 | (2,074) |
Add back: |
|
|
|
|
Share-based compensation1 | 8,136 | 3,784 | (483) | 2,533 |
(Income) loss from equity accounting in investee1 | — | 14 | 14 | 17 |
(Gain) loss on financial instruments1 | 50,737 | 16,628 | (6,561) | 12,842 |
Other (income) expense1 | 1,090 | 535 | 1,116 | (428) |
Loss on extinguishment of Senior Notes1 | — | — | 11,463 | — |
Foreign exchange (gain) loss1 | 7,224 | 5,997 | (5,113) | 311 |
Income tax effect on adjustments | (2,528) | (2,099) | 2,536 | (109) |
Adjusted net earnings | 47,762 | 27,227 | 24,659 | 13,092 |
Adjusted net earnings per share – basic ($/share) | 0.27 | 0.16 | 0.14 | 0.08 |
1. As presented in the financial statements and notes thereto for the respective periods.
Cash Cost and All-in Sustaining Cost
Cash costs per ounce, and all-in sustaining cost per ounce (as calculated in the tables above) are performance measures that reflect certain costs that are required to produce and sell an ounce of gold from operations. Management believes that these two measures are useful to market participants in assessing operating performance and the Company's ability to generate cash flow from current operations. These measures do not have standardized meanings under IFRS and may not be comparable to similar measures used by other issuers.
Operating Cash Flow and Free Cash Flow after Growth and Expansion Capital
Cash flow from operations after sustaining capital and income taxes is calculated as adjusted net cash provided by operating activities, less sustaining capital and income taxes paid. Free cash flow after growth and expansion capital is calculated by further deducting growth and expansion capital. Management believes these measures are useful to market participants in assessing the Company’s ability to generate cash flow from operations after funding its capital requirements. These measures do not have standardized meanings under IFRS and may not be comparable to similar measures used by other issuers.
Growth and Expansion Capital
Growth and expansion capital represents additions to depletable and non-depletable mineral interests, right of use assets, exploration projects, and plant and equipment that are not sustaining in nature. Management believes this measure is useful to market participants in assessing the level of capital invested to expand operations, develop projects and support future growth separately from capital required to sustain current operations. This measure does not have a standardized meaning under IFRS and may not be comparable to similar measures used by other issuers.
EBITDA and Adjusted EBITDA
EBITDA is calculated as earnings before tax, adjusted to add back depreciation and depletion, finance income, and interest and accretion. Adjusted EBITDA is calculated by further excluding items that management does not consider to be reflective of the underlying operating performance. Management believes these measures are useful to market participants in assessing the Company’s operating performance and ability to generate cash flow from operations. These measures do not have standardized meanings under IFRS and may not be comparable to similar measures used by other issuers.
Adjusted Net Earnings and Adjusted Net Earnings Per Share
Adjusted net earnings is calculated as net earnings attributable to owners of the Company, adjusted for items that management does not consider to be reflective of the underlying operating performance of the Company Adjusted net earnings per share is calculated by dividing adjusted net earnings by the basic weighted average number of shares outstanding for the applicable period. Management believes these measures are useful to market participants in assessing the Company’s underlying financial performance and results on a per share basis. These measures do not have standardized meanings under IFRS and may not be comparable to similar measures used by other issuers.
Qualified Person and Technical Information
Pamela De Mark, P.Geo., Senior Vice President Geology and Exploration of Aris Mining, is a Qualified Person as defined by National Instrument 43-101 (NI 43-101), and has reviewed and approved the technical information contained in this news release.
Forward-Looking Information
This news release contains "forward-looking information" or “forward-looking statements" within the meaning of Canadian securities legislation. All statements included herein, other than statements of historical fact, including, without limitation, statements relating to the Company’s ability to deliver on its 2026 objectives, updates and timing for completion, first gold pour and ramp-up at the Marmato CIP plant, the Company’s longer-term growth outlook, the timeline for submission of the environmental license application for the Soto Norte Project, the timeline for a Prefeasibility Study and construction decision for the Toroparu Project, the objective of reaching 1 million ounces of gold production, are forward-looking. Generally, the forward-looking information and forward looking statements can be identified by the use of forward looking terminology such as "plans", "expects" or "does not expect", "is expected", "budget", "scheduled", "estimates", "forecasts", "intends", "anticipates" or "does not anticipate", "will continue" or "believes", or variations of such words and phrases or state that certain actions, events or results "may", "could", "would", "might" or "will be taken", "occur" or "be achieved”. The material factors or assumptions used to develop forward looking information or statements are disclosed throughout this news release.
Forward looking information and forward looking statements, while based on management's best estimates and assumptions, are subject to known and unknown risks, uncertainties and other factors that may cause the actual results, level of activity, performance or achievements of Aris Mining to be materially different from those expressed or implied by such forward-looking information or forward looking statements, including but not limited to those factors discussed in the section entitled "Risk Factors" in Aris Mining's annual information form dated March 11, 2026 which is available on SEDAR+ at www.sedarplus.ca and included as part of the Company’s Annual report on Form 40-F, filed with the SEC at www.sec.gov.
Although Aris Mining has attempted to identify important factors that could cause actual results to differ materially from those contained in forward-looking information and forward-looking statements, there may be other factors that cause results not to be as anticipated, estimated or intended. There can be no assurance that such information or statements will prove to be accurate, as actual results and future events could differ materially from those anticipated in such information or statements. The Company discloses in its Management's Discussion and Analysis and other publicly filed documents, changes to material factors or assumptions underlying the forward-looking information and forward-looking statements and to the validity of the information, in the period the changes occur. The forward-looking statements and forward-looking information are made as of the date hereof and Aris Mining disclaims any obligation to update any such factors or to publicly announce the result of any revisions to any of the forward-looking statements or forward-looking information contained herein to reflect future results. Accordingly, readers should not place undue reliance on forward-looking statements and information.
View source version on businesswire.com: https://www.businesswire.com/news/home/20260729659384/en/
Contact details:
Aris Mining
Oliver Dachsel
Senior Vice President, Capital Markets
+1.917.847.0063
Lillian Chow
Director, Investor Relations & Communications
[email protected]